什麼是瀏覽器開發者工具?
所有現代 Web 瀏覽器都包含一套強大的開發者工具。這些工具可以執行各種任務,從檢查當前載入的 HTML、CSS 和 JavaScript,到顯示頁面請求了哪些資源以及它們的載入時間。本文將介紹如何使用瀏覽器開發者工具的基本功能。
如何在瀏覽器中開啟開發者工具
開發者工具位於瀏覽器內部的一個子視窗中,其外觀大致如下,具體取決於您使用的瀏覽器。
如何調出它?三種方法
-
鍵盤
- Windows: Ctrl + Shift + I 或 F12
- macOS: ⌘ + ⌥ + I
-
選單欄
-
Firefox: 選單(☰)➤ 更多工具 ➤ Web 開發者工具
-
Chrome: 更多工具 ➤ 開發者工具
-
Opera:開發者 ➤ 開發者工具
-
Safari: 開發 ➤ 顯示 Web 檢查器。
注意: Safari 的開發者工具預設未啟用。要啟用它們,請轉到Safari ➤ 偏好設定 ➤ 高階,然後勾選在選單欄中顯示“開發”選單或為 Web 開發者啟用功能複選框。
-
-
上下文選單: 按住/右鍵單擊網頁上的某個專案(Mac 上按住 Ctrl+單擊),然後在出現的上下文選單中選擇檢查元素。(額外好處:此方法會立即突出顯示您右鍵單擊的元素的程式碼。)
檢查器:DOM 瀏覽器和 CSS 編輯器
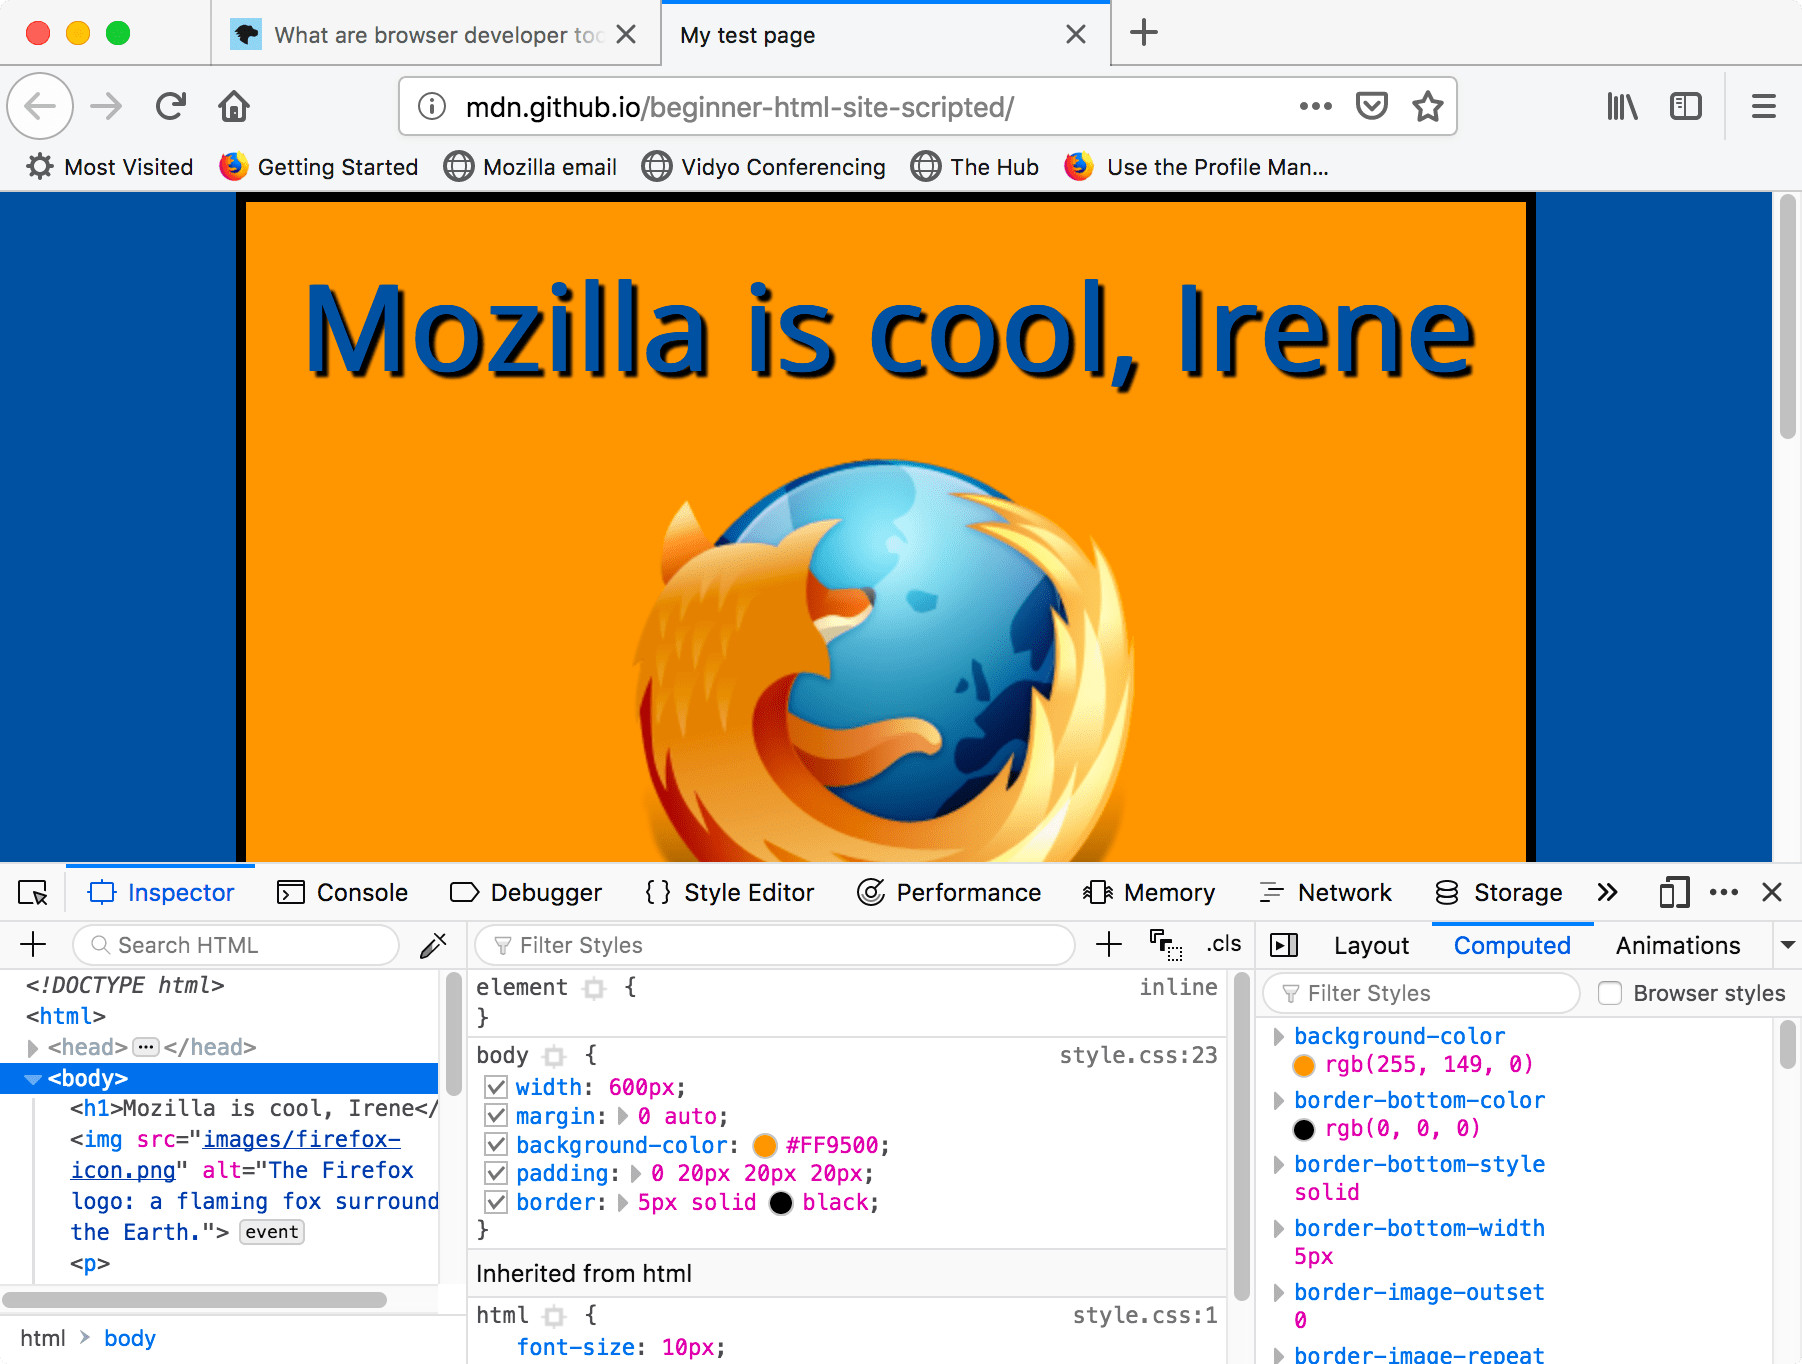
開發者工具通常預設開啟到檢查器,其外觀大致如下面的螢幕截圖所示。此工具顯示您頁面上的 HTML 在執行時是什麼樣的,以及每個元素應用了什麼 CSS。它還允許您即時修改 HTML 和 CSS,並即時檢視更改在瀏覽器視口中的反映。
如果您沒有看到檢查器,
- Firefox: 選擇檢查器選項卡。
- 其他瀏覽器: 選擇元素選項卡。
探索 DOM 檢查器
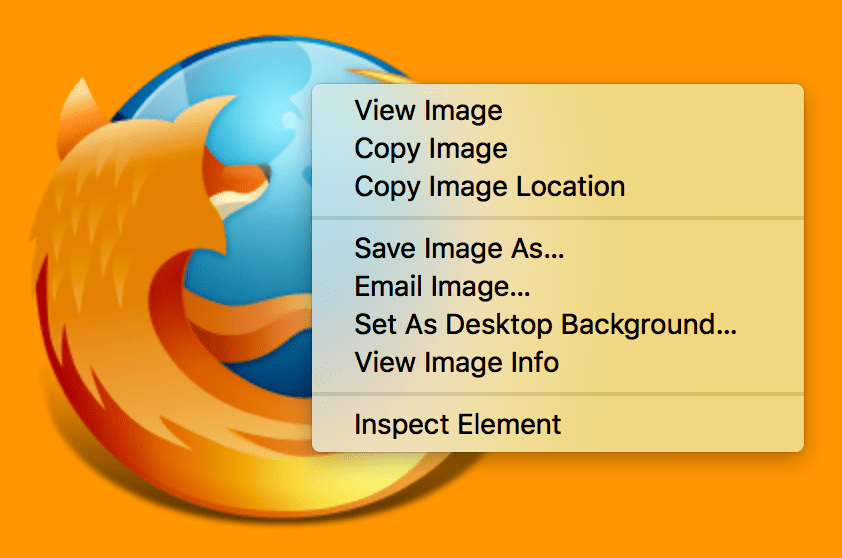
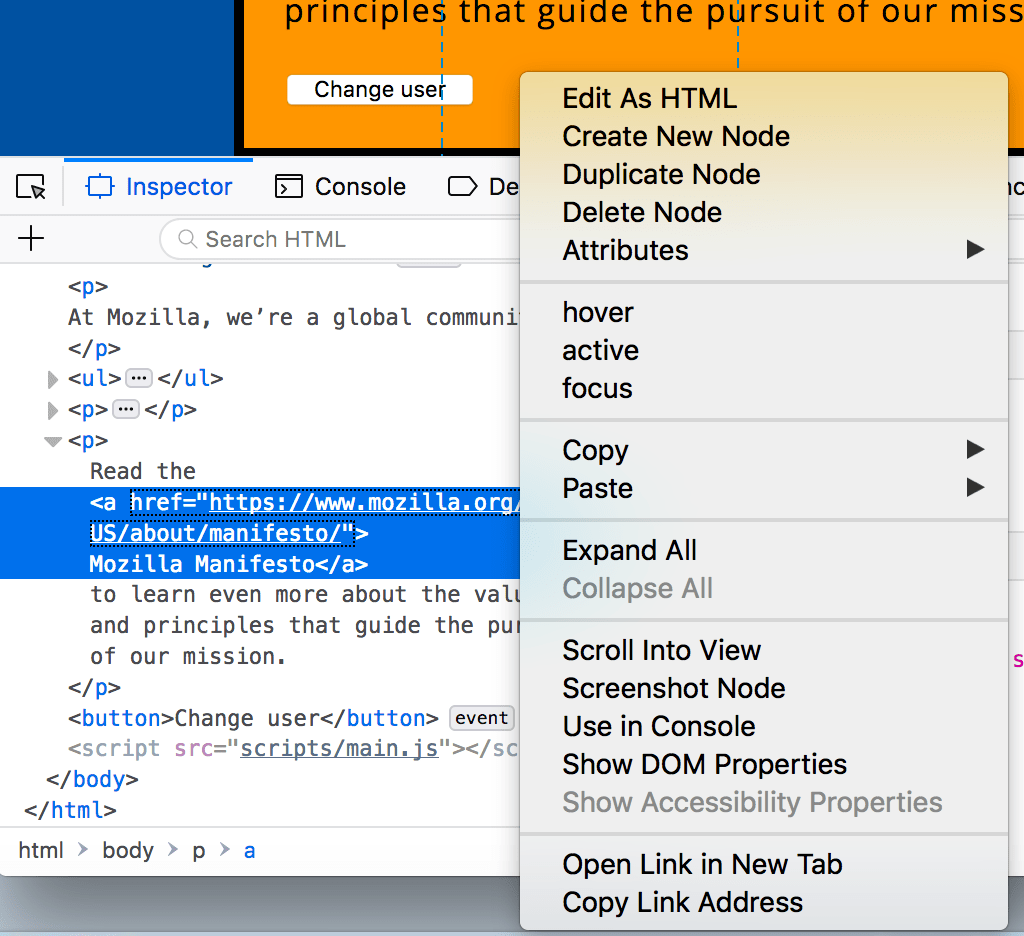
首先,右鍵單擊(Ctrl+單擊)DOM 檢查器中的 HTML 元素,然後檢視上下文選單。可用選單選項因瀏覽器而異,但重要的選項大多相同。
- 刪除節點(有時是刪除元素)。刪除當前元素。
- 編輯為 HTML(有時是新增屬性/編輯文字)。允許您更改 HTML 並即時檢視結果。對於除錯和測試非常有用。
- :hover/:active/:focus。強制切換元素狀態,以便您可以看到其樣式會是什麼樣子。
- 複製/複製為 HTML。複製當前選定的 HTML。
- 一些瀏覽器還提供複製 CSS 路徑和複製 XPath,允許您複製選擇當前 HTML 元素的 CSS 選擇器或 XPath 表示式。
現在嘗試編輯您的 DOM。雙擊一個元素,或右鍵單擊它並從上下文選單中選擇編輯為 HTML。您可以進行任何您想要的更改,但無法儲存更改。
探索 CSS 編輯器
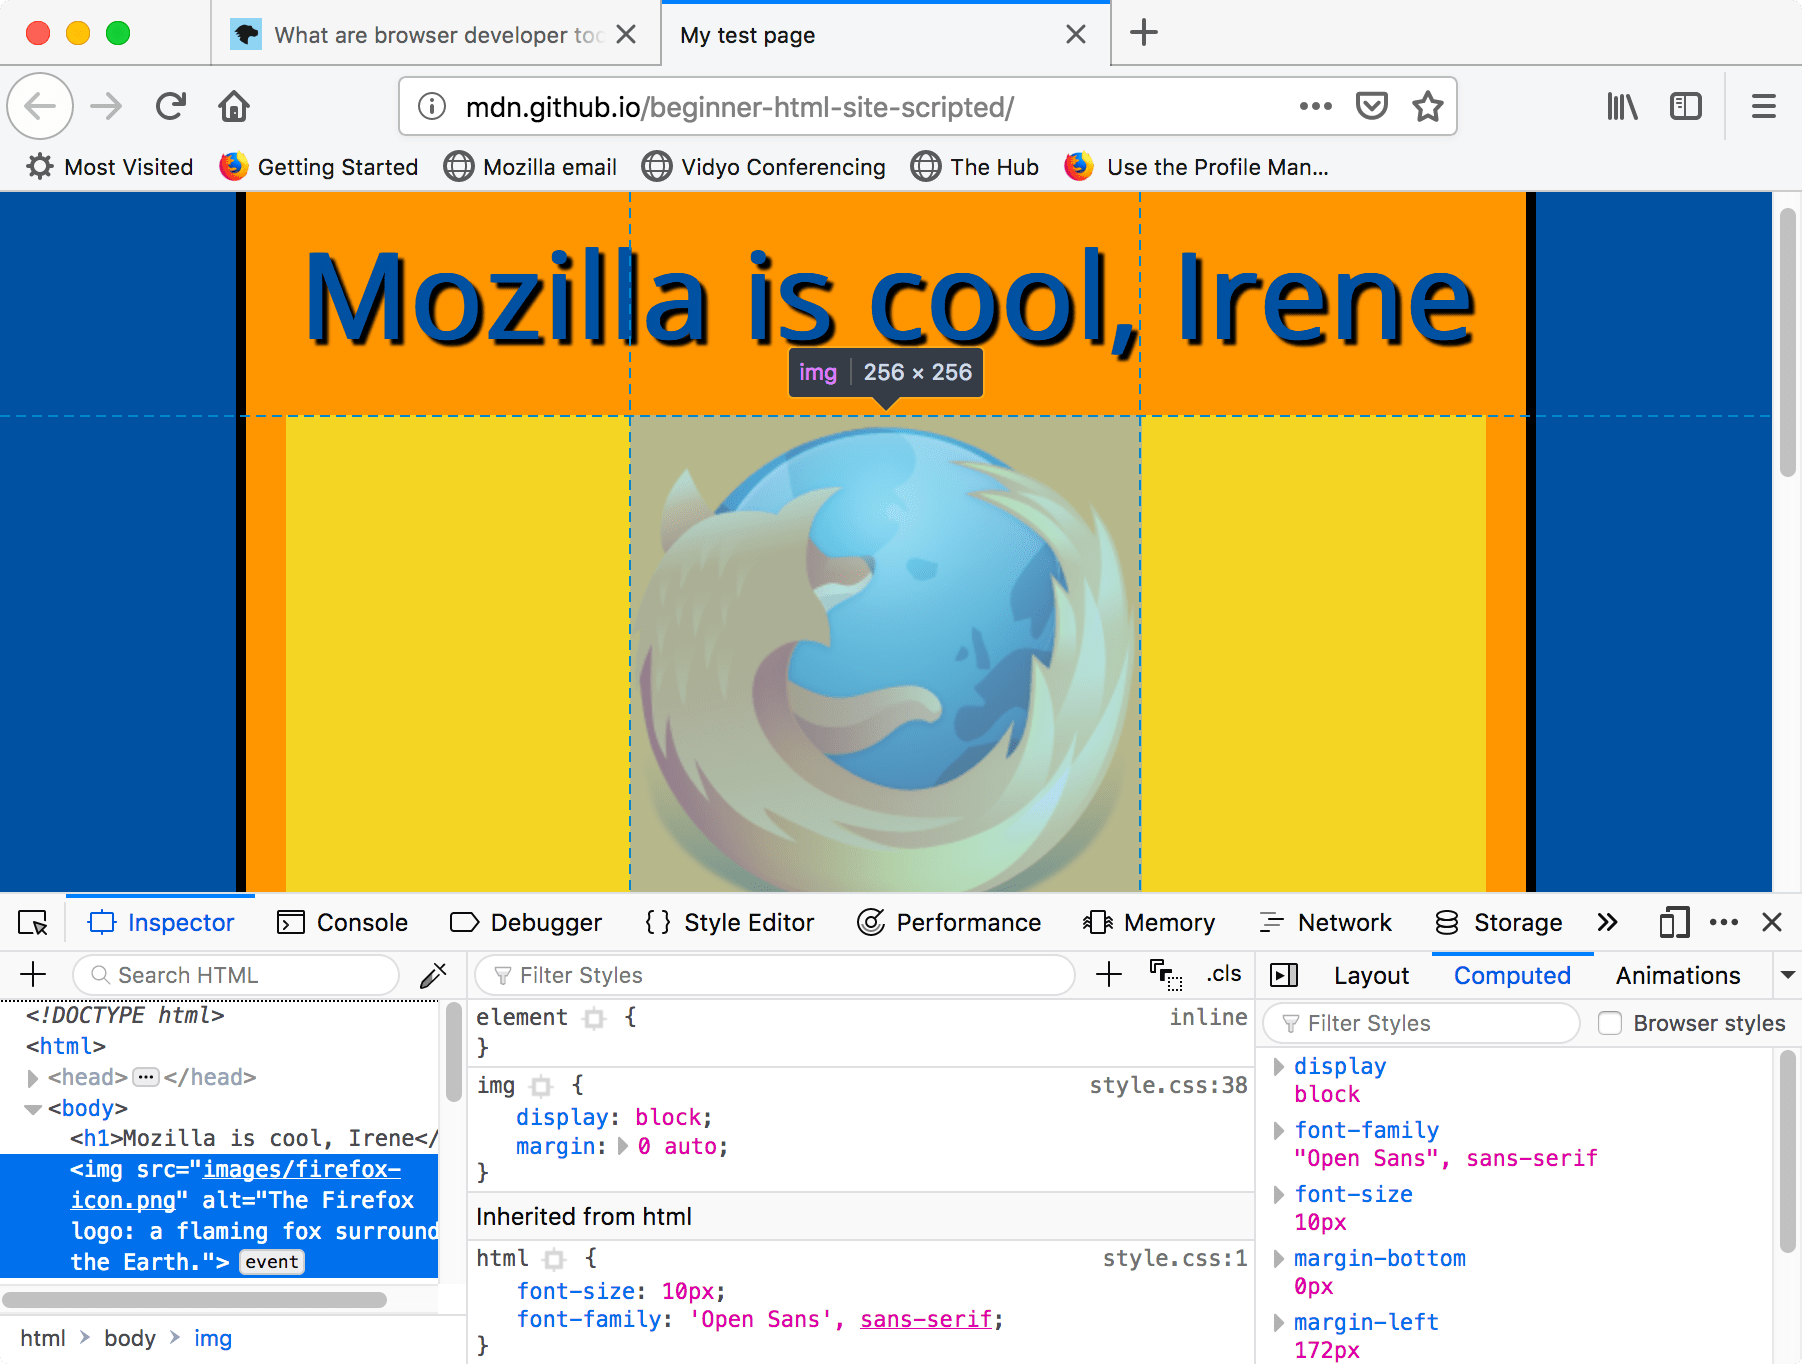
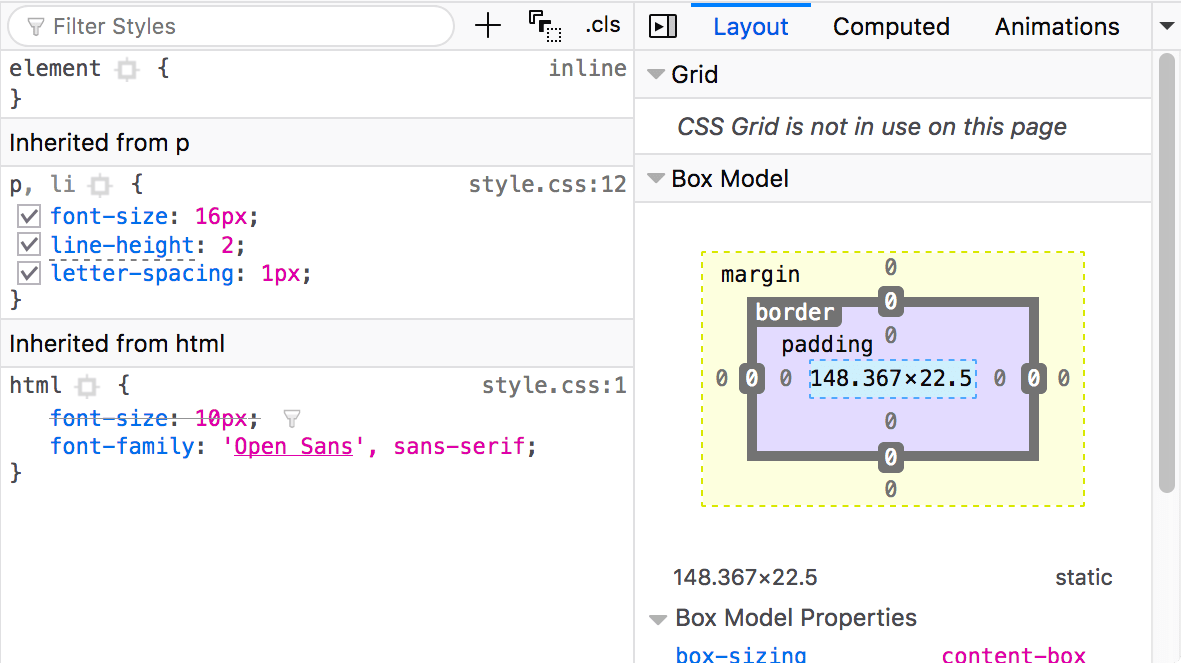
預設情況下,CSS 編輯器顯示應用於當前選定元素的 CSS 規則。
這些功能尤其方便
- 應用於當前元素的規則按從最具體到最不具體的順序顯示。
- 單擊每個宣告旁邊的複選框,看看如果刪除該宣告會發生什麼。
- 單擊每個簡寫屬性旁邊的箭頭,以顯示該屬性的展開式等效項。
- 單擊屬性名稱或值,會彈出一個文字框,您可以在其中鍵入新值以即時預覽樣式更改。
- 每個規則旁邊是該規則定義的檔案的名稱和行號。單擊該規則會使開發者工具跳轉到它自己的檢視中顯示它,在那裡通常可以進行編輯和儲存。
- 您還可以單擊任何規則的閉合大括號,在新行上彈出一個文字框,您可以在其中為頁面編寫一個全新的宣告。
您會注意到 CSS 檢視器頂部有一些可單擊的選項卡。
- 計算值:這顯示了當前選定元素的計算樣式(瀏覽器應用的最終、標準化值)。
- 佈局:如果正在檢查的元素使用了 CSS 網格和 Flexbox 佈局模式,則此選項卡顯示這些模式的詳細資訊。
- 字型:在 Firefox 和 Safari 中,字型選項卡顯示應用於當前元素的字型。
盒模型檢視直觀地表示當前元素的盒模型,因此您可以一目瞭然地看到它應用的內邊距、邊框和外邊距,以及其內容的尺寸。在 Firefox 中,它位於佈局選項卡中,在其他瀏覽器中位於計算值選項卡中。
在某些瀏覽器中,選定元素的 JavaScript 詳細資訊也可以在此面板中檢視。在 Safari 中,這些合併在節點選項卡下,但在 Chrome、Opera 和 Edge 中位於單獨的選項卡中。
瞭解更多
瞭解不同瀏覽器中檢查器的更多資訊
- Firefox 頁面檢查器
- Chrome DOM 檢查器(Opera 和 Edge 的檢查器相同)
- Safari 元素選項卡
JavaScript 偵錯程式
JavaScript 偵錯程式允許您監視變數的值並設定斷點,即您希望暫停執行以識別阻止程式碼正確執行的問題的程式碼點。
如何訪問偵錯程式
Firefox:開啟開發者工具並選擇偵錯程式選項卡。其他瀏覽器:開啟開發者工具並選擇原始碼選項卡。
探索偵錯程式
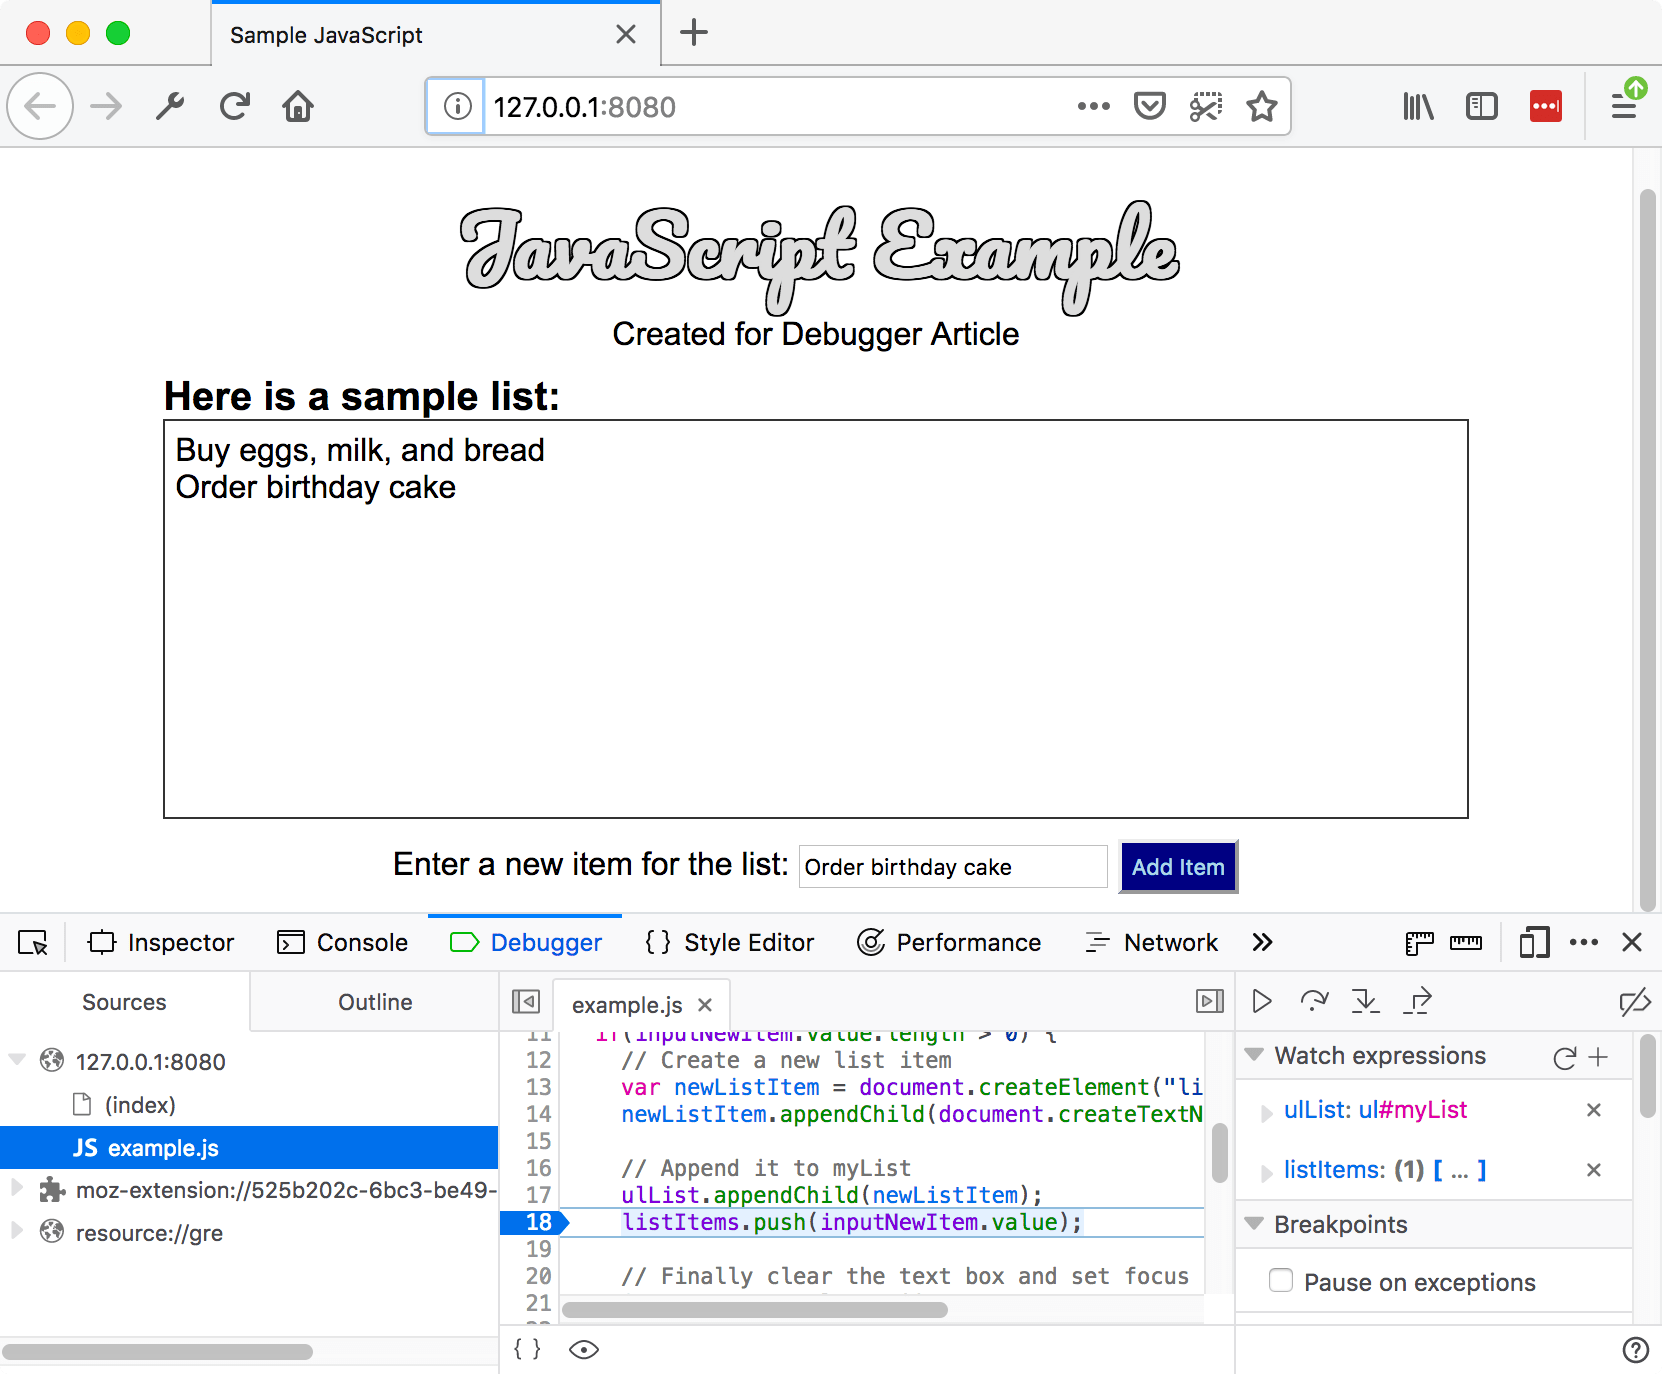
每個瀏覽器的 JavaScript 偵錯程式分為三個窗格。這些窗格的佈局因您使用的瀏覽器而異;本指南以 Firefox 為參考。
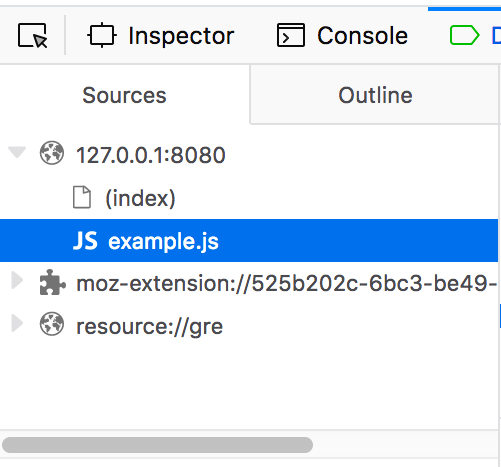
檔案列表
左側的第一個窗格包含與您正在除錯的頁面相關的檔案列表。從列表中選擇要處理的檔案。單擊檔案即可選中它並在偵錯程式的中間窗格中檢視其內容。
原始碼
在希望暫停執行的地方設定斷點。在下圖的數字 18 處的高亮顯示錶明該行已設定了斷點。

監視表示式和斷點
右側窗格顯示您新增的監視表示式和設定的斷點列表。
在影像中,第一部分監視表示式顯示已新增 listItems 變數。您可以展開列表以檢視陣列中的值。
下一部分斷點列出了頁面上設定的斷點。在 example.js 中,在語句 listItems.push(inputNewItem.value); 上設定了一個斷點。
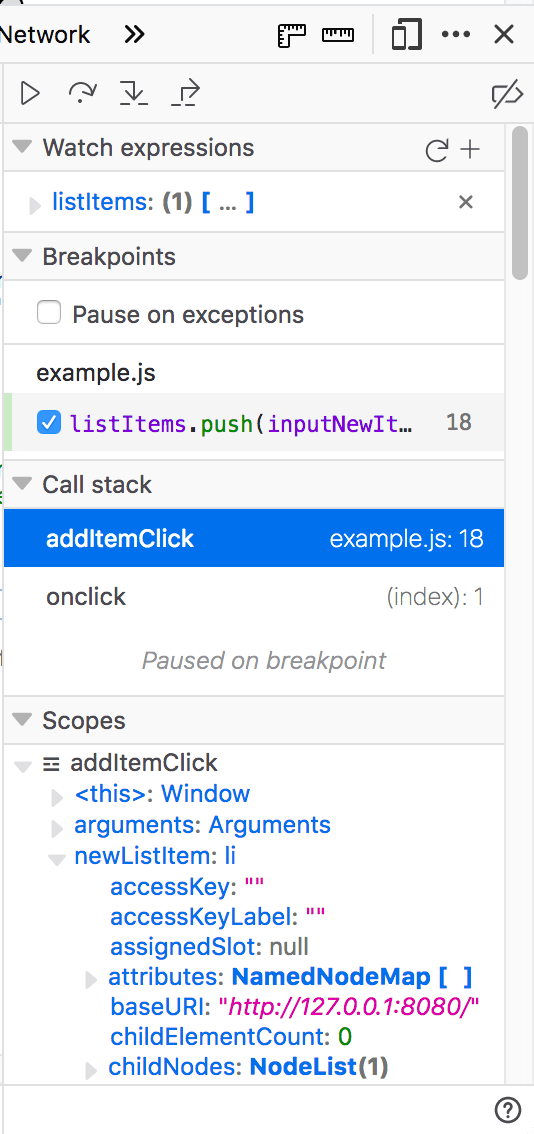
最後兩個部分僅在程式碼執行時出現。
呼叫堆疊部分顯示了執行到當前行所經過的程式碼。您可以看到程式碼位於處理滑鼠單擊的函式中,並且程式碼目前已在斷點處暫停。
最後一節作用域顯示了從程式碼的各個點可見的值。例如,在下圖的 addItemClick 函式中,可以看到可用的物件。
瞭解更多
瞭解不同瀏覽器中 JavaScript 偵錯程式的更多資訊
- Firefox JavaScript 偵錯程式)
- Chrome 偵錯程式(Opera 和 Edge 的偵錯程式相同)
- Safari 原始碼選項卡
JavaScript 控制檯
JavaScript 控制檯是一個非常有用的工具,用於除錯非預期工作的 JavaScript。它允許您針對瀏覽器中當前載入的頁面執行 JavaScript 程式碼行,並報告瀏覽器嘗試執行程式碼時遇到的錯誤。
要在任何瀏覽器中訪問控制檯,請開啟開發者工具並選擇控制檯選項卡。這將為您提供如下視窗:
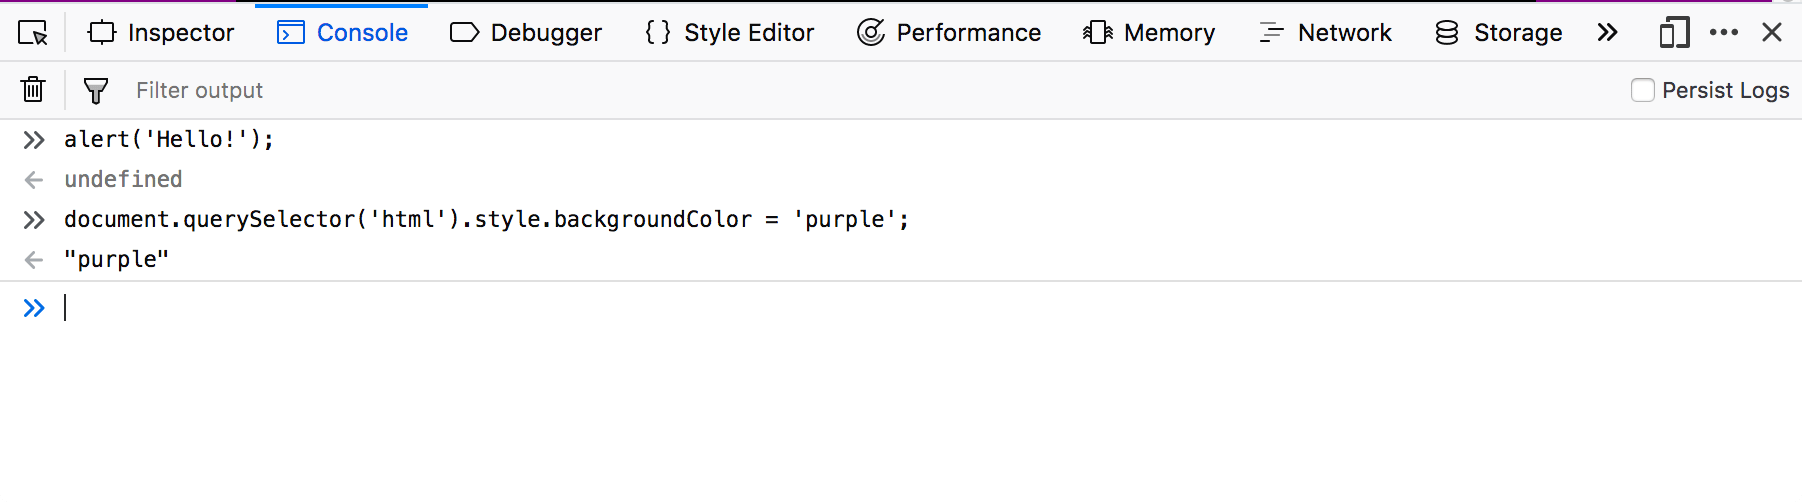
要檢視會發生什麼,請嘗試逐個將以下程式碼片段輸入控制檯(然後按 Enter)。
alert("hello!");
document.querySelector("html").style.backgroundColor = "purple";
const loginImage = document.createElement("img");
loginImage.setAttribute(
  "src",
  "https://raw.githubusercontent.com/mdn/learning-area/master/html/forms/image-type-example/login.png",
);
document.querySelector("h1").appendChild(loginImage);
現在嘗試輸入以下錯誤的 कोड 版本,看看會得到什麼。
alert("hello!);
document.cheeseSelector("html").style.backgroundColor = "purple";
const loginImage = document.createElement("img");
banana.setAttribute(
  "src",
  "https://raw.githubusercontent.com/mdn/learning-area/master/html/forms/image-type-example/login.png",
);
document.querySelector("h1").appendChild(loginImage);
您將開始看到瀏覽器返回的錯誤型別。這些錯誤通常相當晦澀難懂,但應該很容易弄清楚這些問題!
瞭解更多
瞭解不同瀏覽器中 JavaScript 控制檯的更多資訊
- Firefox Web 控制檯
- Chrome JavaScript 控制檯(Opera 和 Edge 的控制檯相同)
- Safari Console Object API 和 Console Command Line API