什麼是瀏覽器開發者工具?
每個現代 Web 瀏覽器都包含一套強大的開發者工具。這些工具可以執行各種操作,從檢查當前載入的 HTML、CSS 和 JavaScript 到顯示頁面請求了哪些資產以及載入這些資產花費了多長時間。本文介紹瞭如何使用瀏覽器開發者工具的基本功能。
如何在瀏覽器中開啟開發者工具
開發者工具位於瀏覽器內的子視窗中,其外觀大致如下所示,具體取決於您使用的瀏覽器

如何將其調出?三種方法
- 鍵盤
- Windows:Ctrl + Shift + I 或 F12
- macOS:⌘ + ⌥ + I
- 選單欄
- Firefox:選單
 ➤ 更多工具 ➤ Web 開發者工具
 - Chrome:更多工具 ➤ 開發者工具
- Safari:開發 ➤ 顯示 Web 檢查器。如果看不到“開發”選單,請轉到Safari ➤ 偏好設定 ➤ 高階,然後選中“在選單欄中顯示開發選單”複選框。
- Opera:開發者 ➤ 開發者工具
- Firefox:選單
- 上下文選單:按住/右鍵單擊網頁上的專案(在 Mac 上按住 Ctrl 鍵單擊),然後從出現的上下文選單中選擇“檢查元素”。(額外獎勵:此方法會直接突出顯示您右鍵單擊的元素的程式碼。)

檢查器:DOM 瀏覽器和 CSS 編輯器
開發者工具通常預設開啟到檢查器,其外觀類似於以下螢幕截圖。此工具顯示頁面上 HTML 在執行時的外觀,以及應用於頁面上每個元素的 CSS。它還允許您即時修改 HTML 和 CSS,並檢視瀏覽器視口中對更改的即時結果。

如果您沒有看到檢查器,
- 點選/點選“檢查器”選項卡。
- 在 Chrome、Microsoft Edge 或 Opera 中,點選/點選“元素”。
- 在 Safari 中,控制元件沒有那麼清晰地顯示,但如果您沒有選擇其他內容顯示在視窗中,則應看到 HTML。按“樣式”按鈕檢視 CSS。
探索 DOM 檢查器
首先,右鍵單擊(按住 Ctrl 鍵單擊)DOM 檢查器中的 HTML 元素,然後檢視上下文選單。可用的選單選項在不同的瀏覽器之間有所不同,但重要的選項大多相同
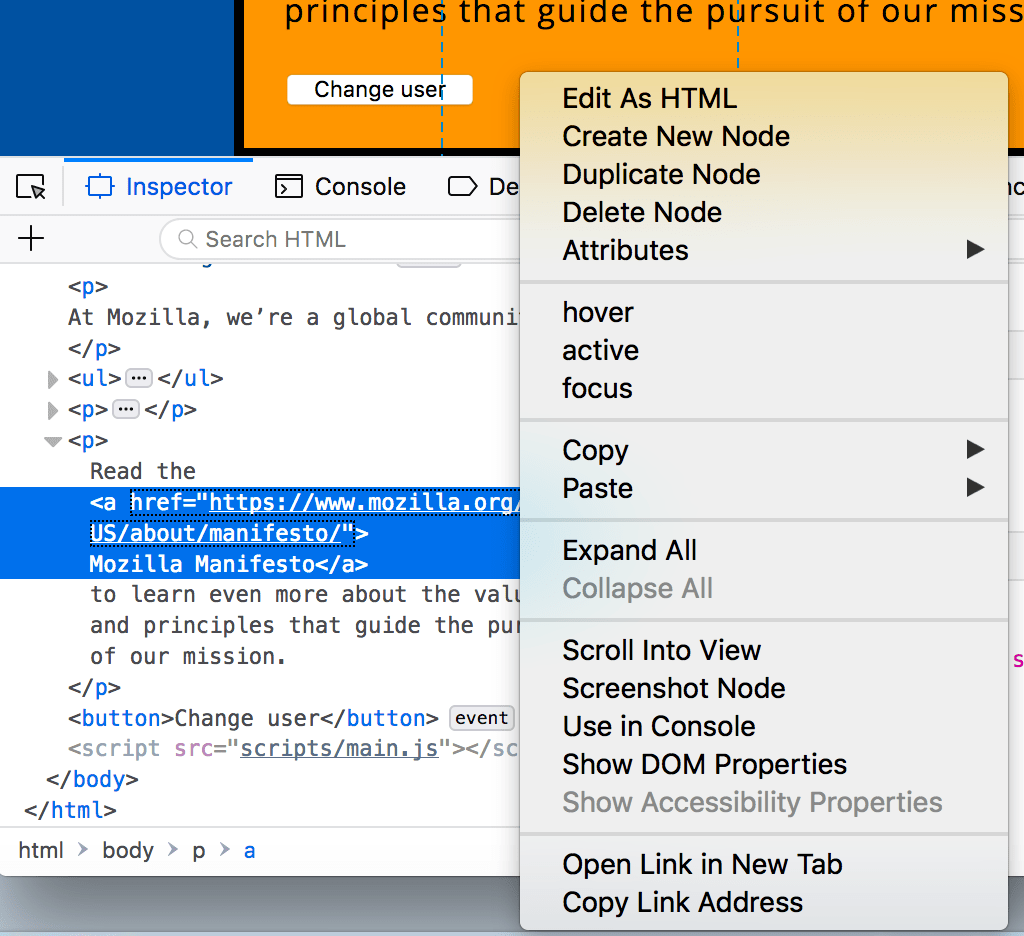
- 刪除節點(有時為刪除元素)。刪除當前元素。
- 以 HTML 形式編輯(有時為新增屬性/編輯文字)。允許您更改 HTML 並即時檢視結果。對除錯和測試非常有用。
- :hover/:active/:focus。強制元素狀態切換,以便您可以檢視其樣式的外觀。
- 複製/複製為 HTML。複製當前選定的 HTML。
- 某些瀏覽器還提供複製 CSS 路徑和複製 XPath,以便您可以複製選擇當前 HTML 元素的 CSS 選擇器或 XPath 表示式。
現在嘗試編輯一些 DOM。雙擊某個元素,或右鍵單擊它並從上下文選單中選擇“以 HTML 形式編輯”。您可以進行任何更改,但無法儲存更改。
探索 CSS 編輯器
預設情況下,CSS 編輯器會顯示應用於當前選定元素的 CSS 規則

這些功能特別方便
- 應用於當前元素的規則按從最特定到最不特定的順序顯示。
- 單擊每個宣告旁邊的複選框以檢視刪除該宣告會發生什麼。
- 單擊每個簡寫屬性旁邊的箭頭以顯示該屬性的完整等效項。
- 單擊屬性名稱或值以調出一個文字框,您可以在其中鍵入新值以獲得樣式更改的即時預覽。
- 每個規則旁邊是定義該規則的檔名和行號。單擊該規則會導致開發者工具跳轉到其自己的檢視中顯示它,通常可以在其中編輯和儲存它。
- 您還可以單擊任何規則的結束大括號以在下一行調出一個文字框,您可以在其中為頁面編寫全新的宣告。
您會注意到 CSS 檢視器頂部有許多可點選的選項卡
- 計算:這顯示了當前選定元素的計算樣式(瀏覽器應用的最終規範化值)。
- 佈局:在 Firefox 中,此區域包含兩個部分
- 盒子模型:以可視方式表示當前元素的盒子模型,以便您可以一目瞭然地瞭解應用了哪些填充、邊框和邊距,以及其內容的大小。
- 網格:如果您正在檢查的頁面使用 CSS 網格,則此部分允許您檢視網格詳細資訊。
- 字型:在 Firefox 中,“字型”選項卡顯示應用於當前元素的字型。
瞭解更多資訊
瞭解有關不同瀏覽器中檢查器的更多資訊
- Firefox 頁面檢查器
- Chrome DOM 檢查器(Opera 的檢查器的工作方式與此相同)
- Safari DOM 檢查器和樣式瀏覽器
JavaScript 偵錯程式
JavaScript 偵錯程式允許您監視變數的值並設定斷點,即程式碼中您希望暫停執行並識別阻止程式碼正確執行的問題的位置。

要訪問偵錯程式
Firefox:選擇 ![]() ➤ Web 開發者 ➤ 偵錯程式或按 Ctrl + Shift + S 開啟 JavaScript 偵錯程式。如果工具已顯示,請點選偵錯程式選項卡。
➤ Web 開發者 ➤ 偵錯程式或按 Ctrl + Shift + S 開啟 JavaScript 偵錯程式。如果工具已顯示,請點選偵錯程式選項卡。
Chrome:開啟開發者工具,然後選擇來源選項卡。(Opera 的工作方式相同。)
Safari:開啟開發者工具,然後選擇偵錯程式選項卡。
探索偵錯程式
Firefox 上的 JavaScript 偵錯程式中有三個窗格。
檔案列表
左側的第一個窗格包含與您正在除錯的頁面關聯的檔案列表。從此列表中選擇您要使用的檔案。單擊檔案以選擇它並在偵錯程式的中央窗格中檢視其內容。

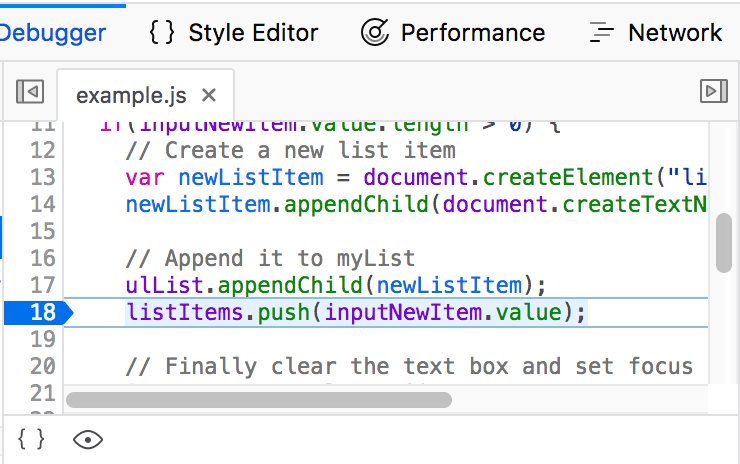
原始碼
設定您希望暫停執行的斷點。在下圖中,數字 18 上的突出顯示錶示該行已設定斷點。
監視表示式和斷點
右側窗格顯示您新增的監視表示式的列表以及您設定的斷點的列表。
在影像中,第一個部分監視表示式顯示已新增 listItems 變數。您可以展開列表以檢視陣列中的值。
下一個部分斷點列出了頁面上設定的斷點。在 example.js 中,已在語句listItems.push(inputNewItem.value);上設定斷點。
最後兩個部分僅在程式碼執行時出現。
呼叫棧部分顯示執行了哪些程式碼才能到達當前行。您可以看到程式碼位於處理滑鼠單擊的函式中,並且程式碼當前已在斷點處暫停。
最後一個部分作用域顯示程式碼中各個點可見的值。例如,在下圖中,您可以看到 addItemClick 函式的程式碼可用的物件。

瞭解更多資訊
瞭解有關不同瀏覽器中 JavaScript 偵錯程式的更多資訊
JavaScript 控制檯
JavaScript 控制檯是一個非常有用的工具,用於除錯 JavaScript 程式碼中出現的問題。它允許你對瀏覽器中當前載入的頁面執行 JavaScript 程式碼行,並在瀏覽器嘗試執行程式碼時報告遇到的錯誤。要訪問任何瀏覽器中的控制檯
如果開發者工具已開啟,請點選或按下“控制檯”選項卡。
如果未開啟,Firefox 允許你使用 Ctrl + Shift + K 直接開啟控制檯,或使用選單命令:選單 ![]() ➤ Web 開發人員 ➤ Web 控制檯,或 工具 ➤ Web 開發人員 ➤ Web 控制檯。在其他瀏覽器中,開啟開發者工具,然後點選“控制檯”選項卡。
➤ Web 開發人員 ➤ Web 控制檯,或 工具 ➤ Web 開發人員 ➤ Web 控制檯。在其他瀏覽器中,開啟開發者工具,然後點選“控制檯”選項卡。
這將為你提供如下所示的視窗

要檢視發生了什麼,請嘗試將以下程式碼片段逐個輸入控制檯(然後按 Enter)
alert("hello!");
document.querySelector("html").style.backgroundColor = "purple";
const loginImage = document.createElement("img");
loginImage.setAttribute(
  "src",
  "https://raw.githubusercontent.com/mdn/learning-area/master/html/forms/image-type-example/login.png",
);
document.querySelector("h1").appendChild(loginImage);
現在嘗試輸入以下程式碼的錯誤版本,看看會得到什麼結果。
alert("hello!);
document.cheeseSelector("html").style.backgroundColor = "purple";
const loginImage = document.createElement("img");
banana.setAttribute(
  "src",
  "https://raw.githubusercontent.com/mdn/learning-area/master/html/forms/image-type-example/login.png",
);
document.querySelector("h1").appendChild(loginImage);
你將開始看到瀏覽器返回的錯誤型別。通常這些錯誤相當隱晦,但這些問題應該很容易解決!
瞭解更多資訊
瞭解不同瀏覽器中的 JavaScript 控制檯的更多資訊
- Firefox Web 控制檯
- Chrome JavaScript 控制檯(Opera 的檢查器與此相同)
- Safari 控制檯